

Commercial
Commercial solar payback in NSW: how to model it so the number survives contact with the bill
Most commercial solar proposals model payback against your average c/kWh rate. That single shortcut is why so many installed systems underperform their business case. Here is the method that does not.
- Revision
- 1.9
- Issued
- 9 August 2026
- Reviewed by
- Set Energy technical team
- Scope
- Commercial solar · NSW · Business and industrial
- Licence
- NSW Electrical Contractor 467699C
For a NSW site with a strong daytime load, three to five years is an achievable commercial solar payback — but only when modelled interval-by-interval. The self-consumption ratio, not the system price, is the variable that decides the result, and any model built on a blended c/kWh rate is optimistic by construction.
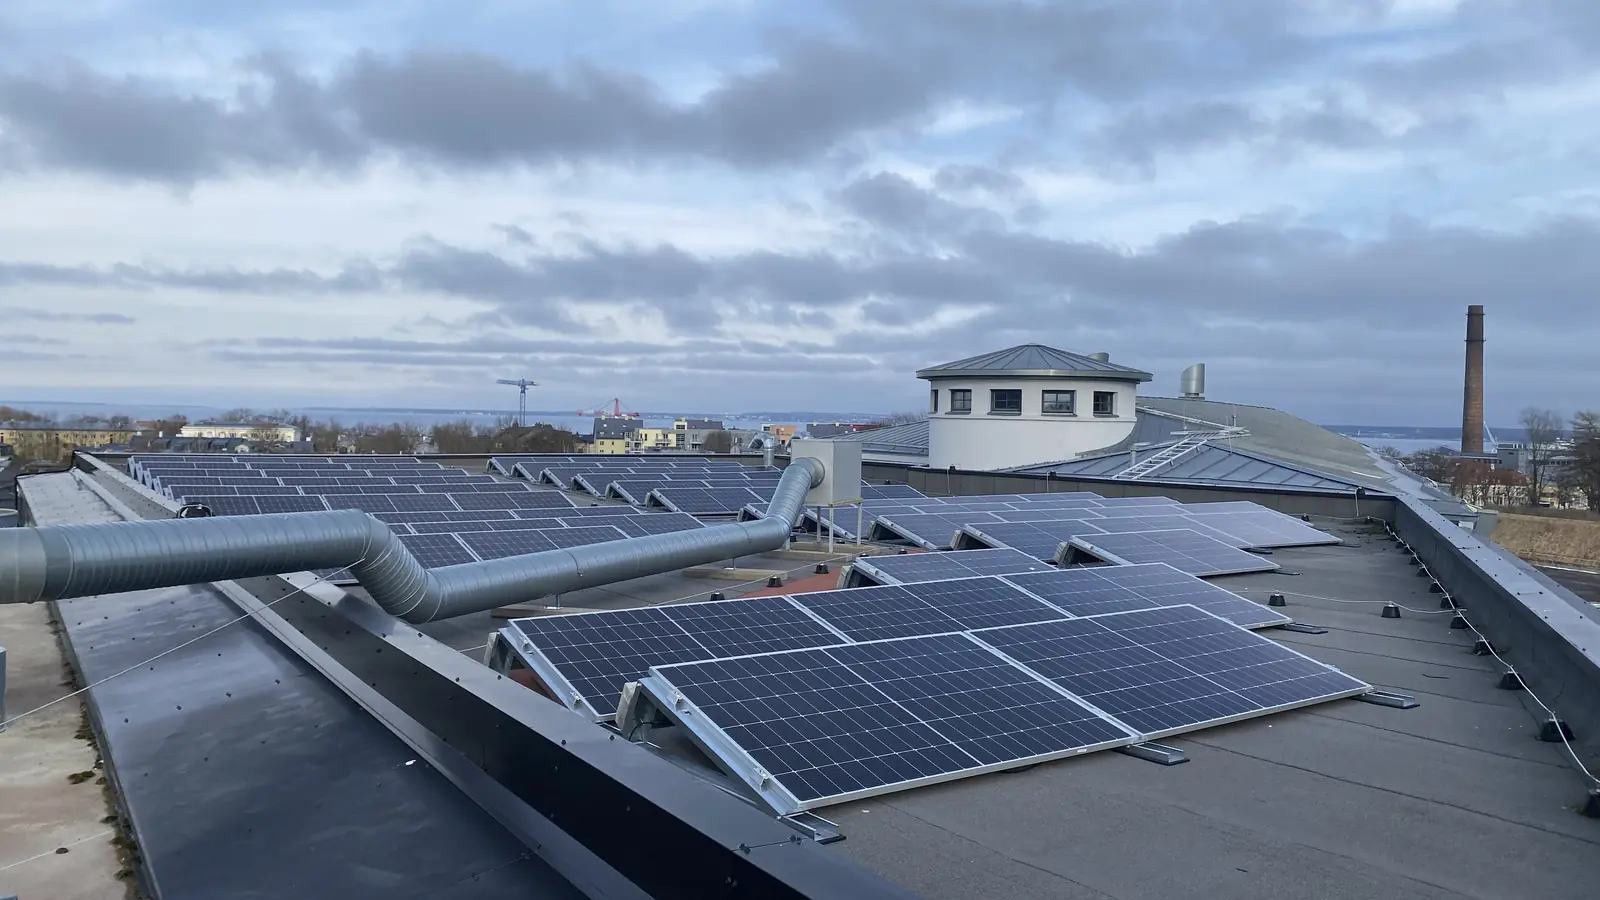
A commercial solar proposal is a financial document wearing an engineering costume. The engineering is usually fine. The finance is usually a single division: system cost divided by (annual generation × average electricity rate). That equation is wrong in at least three places, and it is wrong in the optimistic direction every time.
The shortcut that breaks the model
Using a blended c/kWh rate assumes every kilowatt-hour your system produces displaces a kilowatt-hour you would otherwise have bought at your average price. Three things break that assumption:
- Not all generation is consumed on site. What you export earns a feed-in tariff that is typically a fraction of your import rate.
- Your average rate is not your marginal rate. A commercial bill bundles energy charges, network charges, demand charges, metering and market fees. Solar reduces some of these and none of the others.
- Generation is shaped. Solar produces on a bell curve centred on solar noon. If your load does not sit under that curve, the mismatch is not a rounding error — it is the entire result.
Read the bill properly first
Before anyone sizes an array, extract these six things from twelve months of bills and, ideally, interval data:
| Input | Why it matters |
|---|---|
| Interval data (15 or 30 min) | The only way to know your load shape. Request it from your retailer — you are entitled to it. |
| Energy charges c/kWh by period | Peak, shoulder and off-peak rates differ. Solar displaces mostly peak and shoulder. |
| Demand charge $/kVA or $/kW | Often 20–40% of a commercial bill. Solar only reduces it if your peak coincides with generation. |
| Demand reset method | Monthly reset, rolling 12-month ratchet or annual peak. A ratchet changes the value of demand reduction dramatically. |
| Feed-in tariff | Determines the value of every exported kWh. Frequently a third or less of the import rate. |
| Network tariff class | Whether you are on a low-voltage or high-voltage tariff shapes what solar can and cannot save. |
It is modelling your load from an assumed profile. For a warehouse with a 6am forklift charging peak and a 2pm shutdown, an assumed profile will overstate self-consumption by a wide margin.
Self-consumption is the whole game
The self-consumption ratio — the proportion of generated energy used on site rather than exported — is the single most influential variable in a commercial model. Move it from 90% to 60% and payback typically stretches by years.
| Site type | Load shape | Typical self-consumption |
|---|---|---|
| Cold storage / refrigeration | Flat, high, daytime-weighted | 90–100% |
| Manufacturing, single day shift | Strong daytime block | 85–95% |
| Retail / hospitality | Daytime with evening tail | 70–90% |
| Office / professional | Weekday daytime, dead weekends | 60–80% |
| Warehouse, low process load | Lighting and dock only | 40–65% |
| Evening-weighted operations | Load after generation ends | 30–50% |
Weekends deserve specific attention. A five-day operation exports roughly 28% of its annual generation before you model anything else. That is not a reason to avoid solar — it is a reason to size the array to the weekday load rather than to the roof, and to look seriously at storage.
Demand charges: where solar sometimes does nothing
Demand charges bill you on your highest measured demand in a period, not on your consumption. They are frequently the largest single line on a commercial bill and they behave in a way that surprises people.
Solar reduces your demand charge only if your peak demand occurs during generation hours and the system is reliably producing at that moment. Three failure modes:
- Your peak is at 7am or 6pm. Solar is not there. Demand charge unchanged.
- Your peak is on a heavily overcast summer afternoon. Air conditioning is at maximum, generation is at 20%. The annual peak that sets your charge is precisely the moment solar underperforms.
- You are on a 12-month ratchet. One bad half-hour sets your charge for the next year, and solar has to eliminate that specific interval to save anything.
This is the strongest argument for pairing commercial solar with storage: a battery can shave the demand peak deterministically, where solar can only do it probabilistically. Model the two together, not sequentially.
The 99 kW question
Systems up to 100 kW create STCs, deemed upfront and applied as an immediate discount on the installed price. Above 100 kW the system falls under the large-scale scheme and creates LGCs instead — earned annually on metered output, requiring accredited metering and ongoing administration.
| Up to 100 kW | Above 100 kW | |
|---|---|---|
| Certificate | STC | LGC |
| Timing | Deemed upfront | Created annually on generation |
| Effect on price | Immediate discount | Ongoing revenue stream |
| Admin burden | Handled by installer | Accreditation and annual reporting |
| Cash flow | Front-loaded | Back-loaded |
The practical consequence is that a 99 kW system and a 110 kW system are not eleven percent apart in project terms — they are different projects. Many sites are better served by a 99 kW system now, with a second stage later, than by crossing the threshold in one step. Others genuinely need the scale. The point is that the decision should be made explicitly, not discovered at commissioning.
The model, step by step
- Start with interval data, twelve months, half-hourly.
- Simulate generation for the proposed array — orientation, tilt, shading, inverter clipping — at the same interval resolution.
- Overlay them. For each interval, the lesser of generation and load is self-consumed; the excess is exported.
- Value self-consumed energy at the applicable time-of-use import rate for that interval, including the variable network component.
- Value exported energy at the actual feed-in tariff in your contract.
- Recalculate demand charges interval by interval against the new net load. Do not apply a percentage assumption.
- Subtract the STC or LGC treatment appropriate to system size.
- Add ongoing costs — monitoring, cleaning, inverter replacement provision around year 10–12, insurance.
- Apply degradation, typically around 0.5% per year for current-generation panels.
- Report both simple payback and IRR over 25 years, with a sensitivity table on electricity price and self-consumption.
Worked example: 99 kW on a single-shift manufacturer
Note what dominates: self-consumed energy is worth roughly twenty times exported energy per kilowatt-hour. Every percentage point of self-consumption you can win — by shifting a process, by rescheduling charging, by adding storage — is worth more than a percentage point of extra array efficiency.
What actually kills commercial payback
Export limits imposed at connection
Networks routinely apply export constraints to commercial connections. A system modelled at unrestricted export and then commissioned with a zero-export limit loses its entire export revenue line. Confirm the connection outcome before you finalise the business case, not after.
Inverter clipping designed in by accident
Oversizing DC to AC is normal and usually beneficial. Oversizing it aggressively on a west-facing array in a hot climate produces clipping losses that never appear in the sales model.
Switchboard and infrastructure discovered late
Older commercial switchboards frequently need upgrading to accept the connection. That cost is real, sometimes substantial, and belongs in the model at proposal stage rather than as a variation.
A tenancy shorter than the payback
A seven-year payback in a lease with four years to run is not an investment, it is a gift to the landlord. Where the lease is short, the conversation to have is about a landlord contribution or a rent adjustment, and to have it before installation.
Roof condition and structural capacity
Re-roofing a building three years after installation means paying to remove and reinstall the entire array. Roof age belongs in the feasibility assessment, not the warranty discussion.
Common questions
What is a realistic payback period for commercial solar in NSW?
For a site with a strong daytime load and high self-consumption, three to five years is achievable. For a site that exports a large share of generation, or whose demand peak falls outside generation hours, it can extend well beyond that. The self-consumption ratio matters more than the system price.
Why does my system need to stay under 100 kW?
It does not have to, but the certificate treatment changes at 100 kW. Below that threshold the system creates STCs, deemed upfront as an immediate discount. Above it, the system creates LGCs annually on metered output, which requires accreditation and shifts the benefit from upfront to ongoing.
Will solar reduce my demand charges?
Only if your peak demand occurs while the system is generating well. If your peak is early morning, evening, or on overcast summer afternoons when air conditioning peaks and generation drops, solar alone may reduce demand charges very little. Battery storage addresses this far more reliably.
Do I need interval data to get an accurate proposal?
Yes. Without half-hourly data the self-consumption ratio is an assumption, and it is the variable that most influences the result. Your retailer is required to provide your interval data on request.
Is commercial solar worth it if we lease the building?
It depends on the remaining lease term against the payback period, and on who owns the asset at the end. Where the term is shorter than payback, the workable structures are a landlord contribution, a rent adjustment, or a power purchase arrangement. It is a commercial conversation to have before installation, not after.
Should we add a battery to a commercial solar system?
Consider it seriously where demand charges are a large share of the bill, where your load is evening-weighted, or where an export limit caps what solar alone can deliver. Model the solar and the battery together — sizing them sequentially usually produces the wrong answer for both.
Sources & further reading
- Clean Energy Regulator — small-scale versus large-scale certificate eligibility and the 100 kW threshold
- Australian Energy Regulator — network tariff structure statements for NSW distribution businesses
- Ausgrid, Endeavour Energy and Essential Energy — published network tariffs and embedded generation connection requirements
- AS/NZS 4777.2 — grid connection of energy systems via inverters